Role dashboards
AvailableAdmins see period close, approvals, plans and data health; sellers start on My Pay.
REPORTS & DASHBOARDS
A report catalogue, dashboards for each role and plain-English questions, all limited to what each person may see.
REPORT CATALOGUE
Each report has its own inputs, a grid and a chart. Filter, group by dragging a column, pivot, total, export to Excel, and open the lines behind any number.
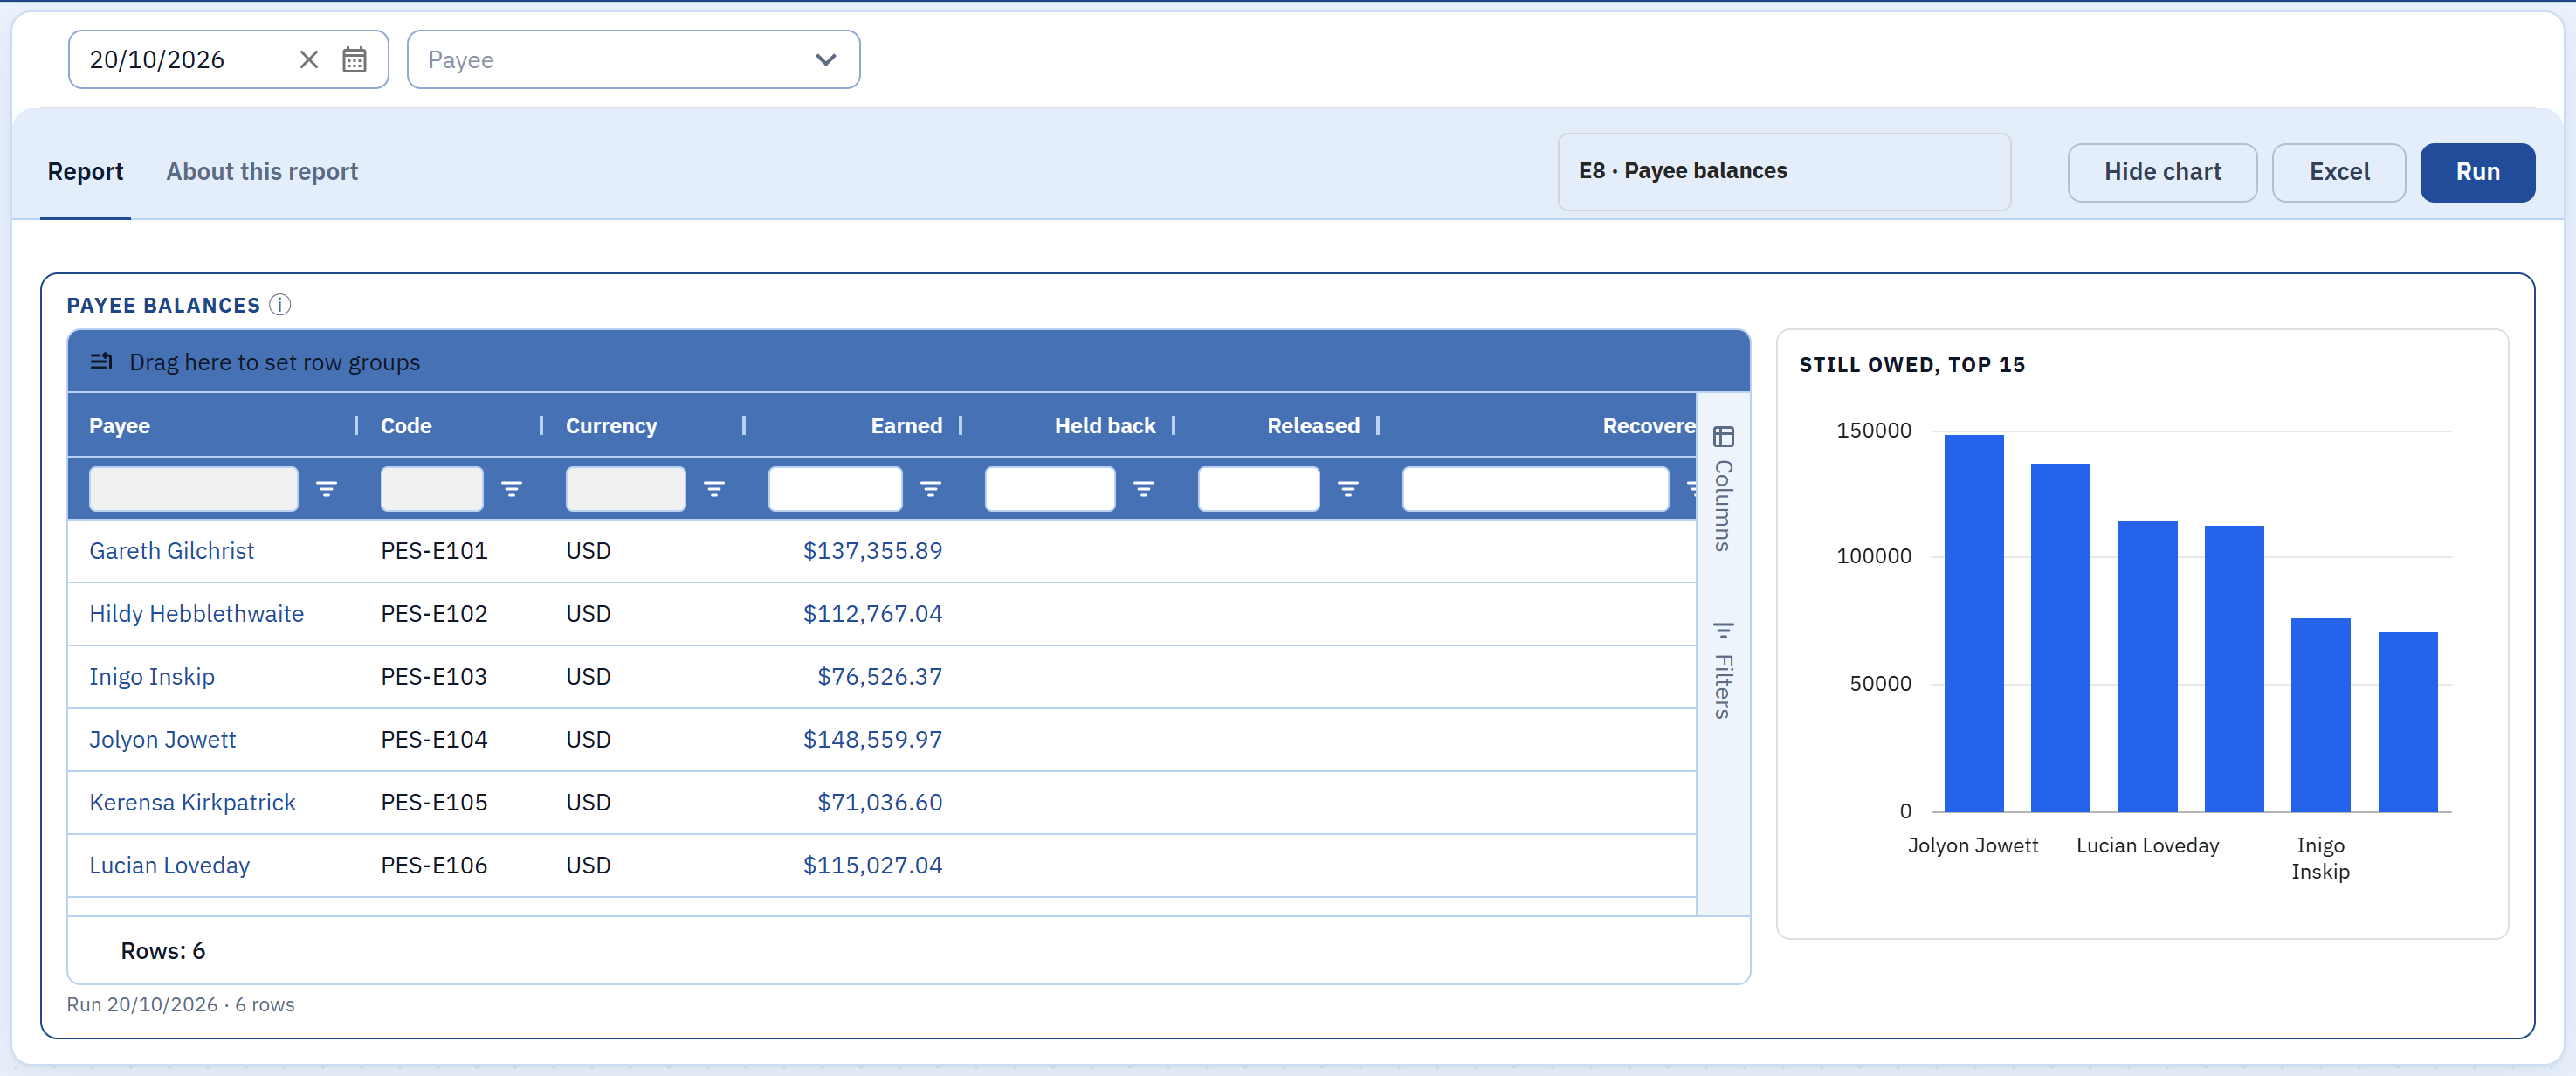
Screens from the RevexOne application, shown with invented test data. Layout may differ in the current release.
| Report | Area | Status |
|---|---|---|
| Invoices received | Sales data in | Available |
| Invoice look-up | Sales data in | Available |
| Invoice impact | Sales to plans | Available |
| Customer coverage | Coverage | Available |
| Plans by employee | Plans and people | Available |
| Team plans | Plans and people | Available |
| Payee balances | Earnings and pay | Available |
| Ledger lines | Earnings and pay | Available |
DASHBOARDS AND QUESTIONS
Admins see period close, approvals, plans and data health; sellers start on My Pay.
Ask in plain English; answers come from the same reports, within your own access.
An agent can propose a chart for a dashboard; a person adds it.
Each payee’s statement, with every line explained.
Every change to plans, data and amounts, with who made it, when and why, on its own page.
Save a report’s settings, share them with approval and schedule delivery.
Default reports for each industry version.
WHO SEES WHAT
Pay columns stay blank unless the person has the right to see them. Managers see their direct reports’ targets and earnings; everyone sees their own.
NEXT STEP
Bring a period of your data and we will show it in these reports.